COVID-19 Mortality in Chicagoland: Data Limitations and Solutions

Report details Heading link
Key findings Heading link
This study demonstrates that when significant “loss of life” from COVID-19 in Long-Term Care Facilities (LTCF) is not accounted for:
- commonly quoted mortality indicators are likely to be inaccurate;
- the spatial distribution of health outcomes is distorted;
- associations of health outcomes with socioeconomic variables are likely concealed; and
- vulnerability model parameters and their association to health outcomes may be misleading.
The results from this study support the recommendation that public health agencies report health outcomes by accounting for LTCF-related mortality. These findings are valid for the Chicagoland area; however, given that high LTCF-related mortality is widespread on a global scale, these recommendations and findings likely have a broad appeal as well.
Summary Heading link
Disseminating reliable information and data is a critical component of an effective risk communication and community engagement (RCCE) strategy to combat any pandemic. During the current public health crisis, many agencies and media outlets are reporting health outcome information based on the overall population of Chicagoland geographic regions. The current study demonstrates that by not accounting for the significant loss of life in Long-Term Care Facilities (LTCF), commonly quoted public health outcome indicators are likely to be inaccurate. Identification of regions with high levels of mortality and infection is a prerequisite for an effective mitigation strategy to protect the public and allocate resources.
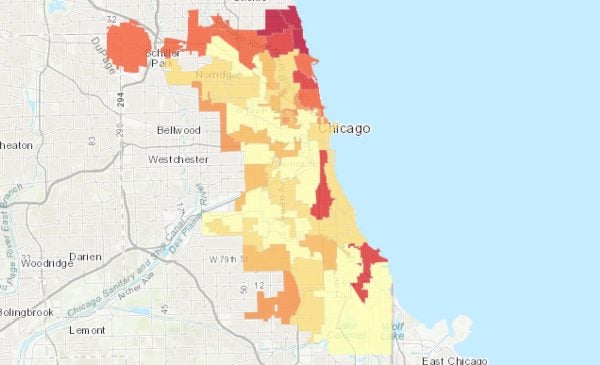
The common practice for visualizing pandemic information is to rely on overall population loss figures and ratios. The current study demonstrates that by doing so, the spatial distribution of Chicagoland critical areas is likely to be distorted. In the current crisis, inequitable public health outcomes are associated with economic and social factors. Separating Chicagoland mortality into two groups, LTCF and household unit populations, and focusing on the latter, allows us to better discern associations with socioeconomic variables for the general population. This finding has a significant implication on the variable selection and model specification for social vulnerability studies.
Background Heading link
The Census Bureau classifies all people not living in housing units as living in “group quarters”.1 Subsequently, Health- Related Group Quarters (HRGQ) facilities2 is the term used to describe nursing, rehabilitation care, and assisted living centers; in this brief, we will be using the term Long-Term Care Facilities (LTCF) adopted by the agencies of the state of Illinois.3 The segment of the population residing in LTCF has distinct characteristics, such as location and medical needs. LTCF residents are a vulnerable population due to the density of the relatively homogenized group in terms of age, multifaceted health needs, and in many cases, underlying chronic diseases. Reports from various public health agencies across the country have recorded an alarming level of deaths and COVID-19-infected cases.4 In the state of Illinois the total deaths among residents in LTCF as of July 17, 2020, was 3,974 (54.8 percent of the total number of state level fatalities).3 On a global scale a similar trend was discerned and by May 11, 2020, Norway and Spain were reporting death tolls related to LTCF as a percent of the total above 60 percent.5 These numbers corroborate the significance of LTCF-related mortality beyond the borders of Illinois.
In this methodology brief, we will not attempt to analyze the causes of the LTCF disproportionate loss from COVID-19. The main objective of this project is to focus on the implications that the magnitude of LTCF losses has on methods for analyzing and visualizing the pandemic data and deriving reliable data-driven decision support information. These methods are critical for public health policymakers and government officials, who require practical and reliable information to implement mitigation measures and allocate resources to serve the infected public (e.g., expected hospital bed utilization per region). Location becomes critical for many mitigation measures, and by not accounting for LTCF, the identification of high mortality areas (i.e., clusters) is distorted.
The majority of communications and online portals from public health agencies provide overall population information3,6,7 and do not separate COVID-19 health indicators (e.g., COVID-19 mortality per county) in terms of the population living in housing units and the vulnerable residents in LTCF. While many states did not communicate this dimension of the pandemic, the state of Illinois and the Illinois Department of Public Health (IDPH) provided a detailed record of the fatalities in LTCF for each county.3 As a risk communication and community engagement measure, the release of LTCF information can enhance awareness of the LTCF-related issue and justify the need for immediate measures. A drawback of this release is its non-database format, or the lack of a portal with such a database.
Explore the data Heading link


Conclusions and recommendations Heading link
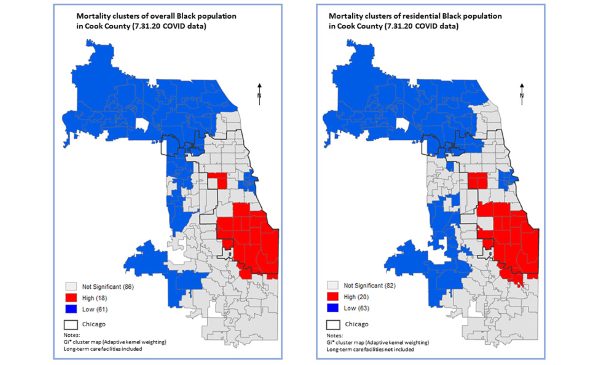
This study demonstrates that when examining COVID-19 mortality it is important to distinguish LTCF-related mortality. Specifically, commonly quoted mortality indicators may be inaccurate and disguise the toll on certain sub-populations, such as was found for the Latinx Chicagoland communities. In addition, the alarming levels of LTCF-related mortality are concealed. Reliably identifying regions with high levels of mortality and infection is a prerequisite for implementing effective mitigation measures and preparedness and response plans to protect the public and allocate resources. The common practice for visualizing pandemic information is to rely on overall population loss figures and ratios; by doing so, the spatial distribution of Chicagoland critical areas is likely to be distorted. Separating mortality into two groups, LTCF and household unit populations, and focusing on the latter, allows us to better discern spatial patterns and critical areas. Without accounting for these two geographically distinct populations, spatial autocorrelation and hot spot analysis methodologies may yield questionable results. From an emergency management perspective, this separation is critical since the mitigation measures for each population differ. In the current crisis, inequitable public health outcomes are associated with economic and social factors that are likely to exacerbate them. By not accounting for the two distinct populations, these associations are likely to be concealed, limiting the ability to ascertain causal relationships.
The results from this study support a key recommendation that public health agencies report health outcomes by separately accounting for LTCF-related mortality. At a practical level, there is the need to operationalize the LTCF information by organizing it in a relational database format and making it accessible for public and research use from a reliable dissemination portal such as the IDPH.14
These findings are valid for the Chicagoland area; however, given that high LTCF-related mortality is widespread on
a global scale, it is likely that the recommendations and findings have a broad appeal as well.
About the authors Heading link
The Policy, Practice and Prevention Research Center (P3RC) helps to build and use evidence to promote policy, systems, and environmental change; build capacity of our partners to identify and understand root causes of inequities; and build collective leadership to advance policies and practices that improve population health and equity.
Matthew Blaser is a geographic information systems research associate at the U.S. Environmental Protection Agency (EPA).
Michael D. Cailas, PhD, is an associate professor of environmental and occupational health sciences at the UIC School of Public Health. He directs SPH’s Public Health Geographic Information Systems online certificate program, and his research focuses on water quality monitoring network design, environmental data analysis, risk assessment and cost benefit analysis
John Canar, PhD in Environmental and Occupational Health Sciences ’97, is an environmental scientist at the U.S. EPA’s Superfund Division and an adjunct assistant professor of health policy and administration at the UIC School of Public Health.
Brian Cooper is a program manager with the U.S. EPA’s Field Environmental Decision Support team within the Superfund Division and an affiliate faculty member with SPH’s division of health policy and administration.
Peter J. Geraci is an affiliate faculty member with SPH’s division of health policy and administration.
Kristin Osiecki, PhD in Environmental and Occupational Health Sciences ’13, MS in Environmental and Occupational Health Sciences ’11, is an assistant professor at the University of Minnesota Rochester and an adjunct instructor of health policy and administration at the UIC School of Public Health.
Apostolis Sambanis, PhD in Environmental and Occupational Health Sciences ’16, MS in Environmental and Occupational Health Sciences ’12, is the director of curriculum with SPH’s Emergency Management and Resilience Planning certificate program.
References Heading link
- U.S. Census Bureau. Group Quarters/Residence Rules. Accessed 12 April 2020.
- U.S. Census Bureau STUDY SERIES (Survey Methodology #2013-06). Ethnographic Study of the Group Quarters Population in the 2010 Census: Healthcare Facilities (Long Term and Hospice Care). Accessed 15 April 2020.
- Long-Term Care Facility Outbreaks COVID-19. Accessed 26 June 2020.
- McMichael TM, Currie DW, Clark S, et al. Epidemiology of Covid-19 in a Long-Term Care Facility in King County, Washington. N Engl J Med. 2020; 382(21):2005–2011.
- Coronavirus disease 2019 (COVID-19) in the EU/EEA and the UK – tenth update, 11 June 2020. Stockholm: ECDC; 2020.
- Medical Examiner Case Archive – COVID-19 Related Deaths. Accessed 26 June 2020.
- City of Chicago: Daily COVID-19 status report. Accessed 26 June 2020.
- International Organization for Standardization (2005): Quality management systems – Fundamentals and vocabulary (ISO 9000:2005).
- World Health Organization (WHO). Novel Coronavirus (2019-nCoV) Situation Report – 13. 2 February, Geneva; 2020.
- Earnest A, Chen M, Ng D, Yee L. Using autoregressive integrated moving average (ARIMA) models to predict and monitor the number of beds occupied during a SARS outbreak in a tertiary hospital in Singapore. BMC health services research. 2005; 5.36.10.1186/1472-6963-5-36.
- Kermack WO, McKendrick AG. A Contribution to the Mathematical Theory of Epidemics. Proc. Roy. Soc. Lond. 1927; A 115, 700-721, 1927.
- Sarbaz H A, Rizgar K, Sadegh S. Mathematical modelling for coronavirus disease (COVID-19) in predicting future behaviours and sensitivity analysis Math. Model. Nat. Phenom. 2020; 15 33. DOI: 10.1051/ mmnp/2020020
- U.S. Department of Health & Human Services. Centers for Disease Control and Prevention (CDC). Forecasts of Total Deaths. Accessed June 25 2020.
- Illinois Department of Public Health (IDPH): Coronavirus Disease 2019. Accessed June 25 2020.
- ESRI; ArcGIS Pro. Data classification methods. Accessed May 12 2020.
- ESRI; ArcGIS Pro. Spatial Autocorrelation (Global Moran’s I, Spatial Statistics). Accessed May 17 2020.
- Goovaerts P. Geostatistics for Natural Resources Evaluation. Applied Geostatistics Series, Oxford University Press, New York; 1997.
- Burton C, Rufat S, Tate E. Social Vulnerability: Conceptual Foundations and Geospatial Modeling. In: Fuchs S, Thaler T, eds. Vulnerability and resilience to natural hazards. Cambridge University Press; 2018.