Visualizing COVID-19’s Impact by Racial Demographics
Report quick links Heading link
Introduction Heading link
In addition to the contrast of COVID-19 mortality per ZIP code by residency status (household populations versus long-term care facility populations), an additional contrast occurs when comparing outcomes across racial groups.
Examining White populations in Chicago Heading link
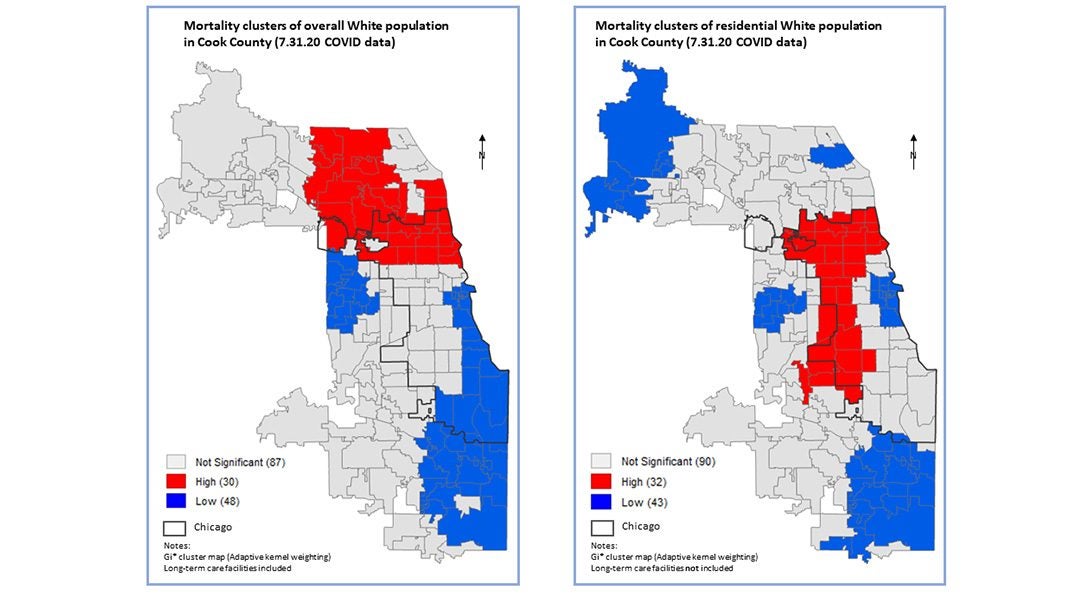
The map above demonstrates the contrast of clustering (hot spots) for mortality of the overall White population (left side) compared to the residential White population. This spatial difference shows the importance of the locations of long-term care facility mortality in the White population, whose distribution more closely matches the figure on the left side. (Clusters, hot spots, were determined using the Getis-Ord Gi spatial autocorrelation statistical method in the GeoDa software.) This complete different spatial pattern of mortality clusters is expected due to the significant White long-term care facility losses (24.9 percent versus 15.0 percent for the residential White population).
Examining Black populations in Chicago Heading link
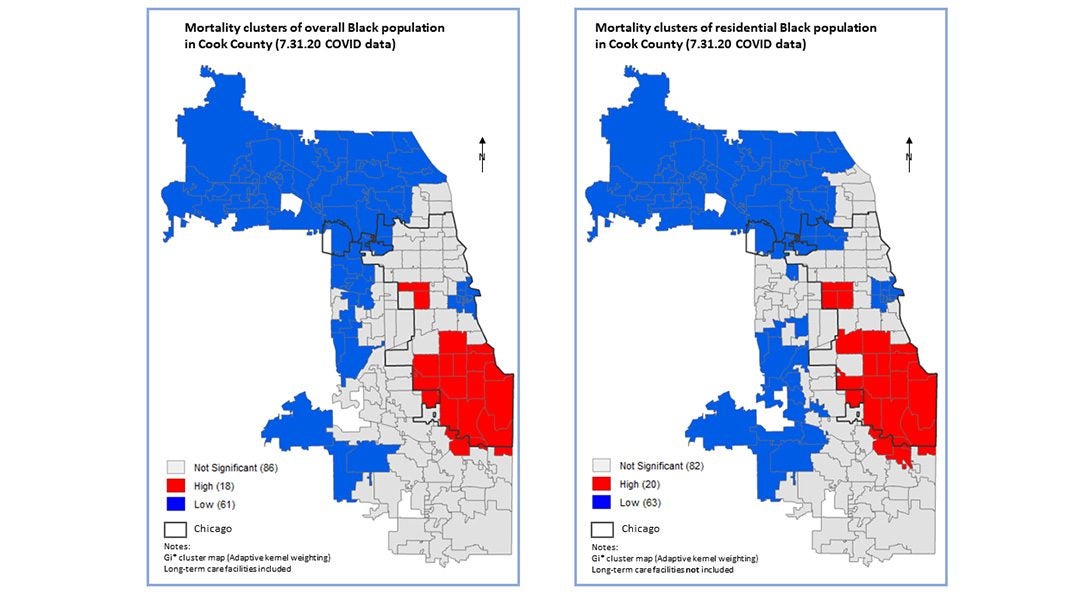
For the Black population, these clusters are distorted to a lesser degree as seen in the maps above. A more thorough analysis of these patterns is presented in a forthcoming article.