COVID-19 Data Analysis: ZIP Code Data and Health Inequities
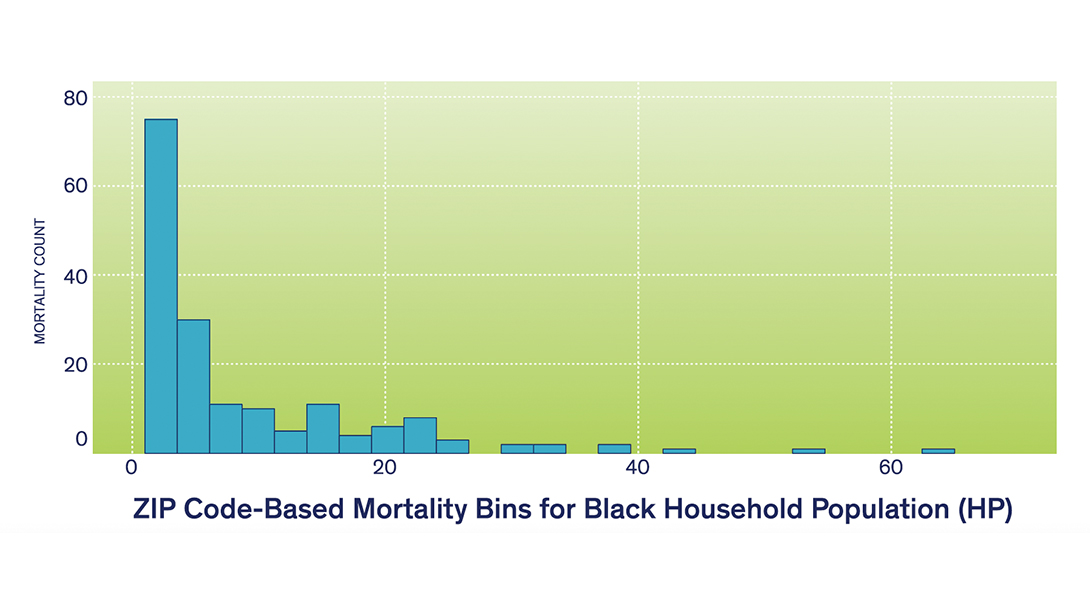
Distribution of mortality per ZIP code for Black household population in Chicagoland (as of July 1, 2020).
Introductory text Heading link
Analyzing the COVID-19 fatalities of household residents by race/ethnicity, as opposed to the overall population, is likely to add another dimension to the health inequity crisis occurring in major metropolitan centers like Chicago. Loss of life per ZIP code is a highly skewed distribution with the majority of ZIP codes registering few fatalities.
Report quick links Heading link
Top 10 ZIP code mortalities by race and their averages for household populations in Chicagoland Heading link
| White | Black | Latinx | Overall | ||||
|---|---|---|---|---|---|---|---|
| ZIP | Fatalities | ZIP | Fatalities | ZIP | Fatalities | ZIP | Fatalities |
| 60632 | 19 | 60628 | 67 | 60623 | 81 | 60649 | 140 |
| 60623 | 18 | 60649 | 52 | 60804 | 50 | 60623 | 138 |
| 60639 | 17 | 60620 | 49 | 60639 | 49 | 60714 | 136 |
| 60630 | 15 | 60619 | 47 | 60629 | 49 | 60626 | 110 |
| 60638 | 15 | 60644 | 35 | 60632 | 40 | 60625 | 101 |
| 60629 | 14 | 60636 | 35 | 60647 | 32 | 60639 | 100 |
| 60625 | 14 | 60617 | 33 | 60608 | 31 | 60628 | 91 |
| 60804 | 12 | 60643 | 30 | 60609 | 24 | 60453 | 90 |
| 60016 | 12 | 60623 | 29 | 60618 | 242 | 60629 | 86 |
| 60634 | 11 | 60651 | 25 | 60641 | 20 | 60632 | 85 |
| Average | 14.7 | Average | 40.2 | Average | 40.0 | Average | 105.3 |
Top 10 ZIP code mortalities by race and their averages for Chicagoland populations living in long-term care facilities (LTCF) Heading link
| White household population | White LTCF population | Black household population | Black LTCF population | ||||||
|---|---|---|---|---|---|---|---|---|---|
| ZIP | Fatalities | ZIP | Fatalities | Mortality rate as percentage of group quarters population | ZIP | Fatalities | ZIP | Fatalities | Mortality rate as percentage of group quarters population |
| 60623 | 19 | 60714 | 62 | 4.9 | 60628 | 67 | 60649 | 81 | 8.4 |
| 60623 | 18 | 60626 | 48 | 1.4 | 60649 | 52 | 60453 | 38 | 7.0 |
| 60639 | 17 | 60614 | 36 | 0.9 | 60620 | 49 | 60644 | 33 | 3.4 |
| 60630 | 15 | 60463 | 35 | 4.1 | 60619 | 47 | 60626 | 31 | 0.9 |
| 60638 | 15 | 60090 | 34 | 5.9 | 60644 | 35 | 60652 | 28 | 13.5 |
| 60629 | 14 | 60068 | 33 | 6.4 | 60636 | 35 | 60628 | 22 | 3.5 |
| 60625 | 14 | 60016 | 32 | 3.7 | 60617 | 33 | 60430 | 22 | 6.8 |
| 60804 | 12 | 60640 | 32 | 1.2 | 60643 | 30 | 60473 | 21 | 3.0 |
| 60016 | 12 | 60706 | 30 | 6.9 | 60623 | 029 | 60621 | 18 | 2.8 |
| 60634 | 11 | 60202 | 29 | 4.4 | 60651 | 25 | 60625 | 16 | 0.7 |
| Average | 14.7 | Average | 37.1 | 3.8 | Average | 40.2 | Average | 31.0 | 5.0 |
Modified on August 27, 2020