Midwest COVID-19 Data Dashboard
The School of Public Health's Public Health Geographic Information Systems certificate program created these COVID-19 data dashboards to strengthen operational insights that enhance data-driven decisions. They were explicitly designed to overcome some of the limitations identified during the COVID-19 pandemic and the plethora of dashboards it created.
Data for households, nursing homes and total populations
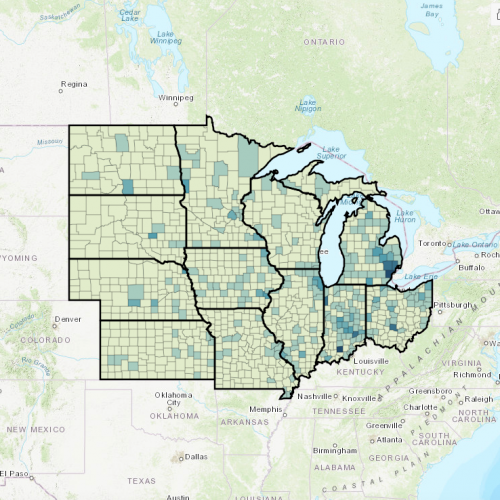
Cumulative fatality rates
A county-by-county analysis across Midwestern states of the death rate due to COVID-19 per 100,000 people.
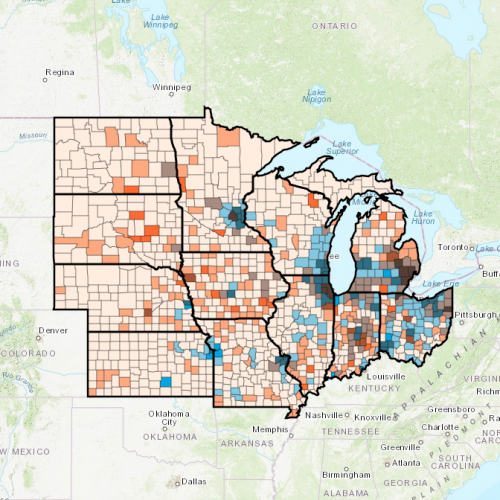
Fatalities by waves
Distinct spikes in COVID-19 infections and deaths are charted for Midwestern states.
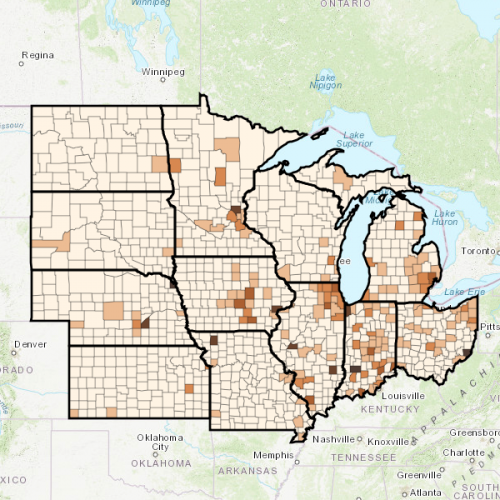
Rural and urban populations
Tracking the rise and fall of COVID-19 deaths based on rural and urban characteristics of Midwestern counties.
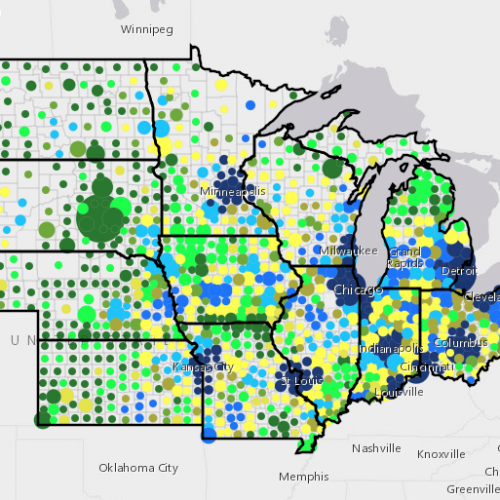
Fatalities and population density
Comparing fatalities in different waves of COVID-19 infections and population density of counties.
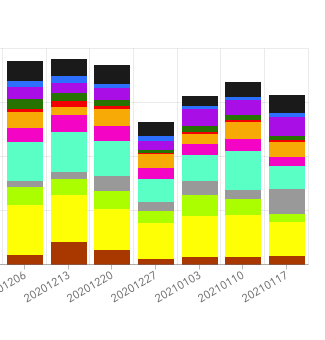
Total fatalities by week
A time series look at the proportion of household and nursing home deaths by each Midwest state across the weeks of the pandemic.
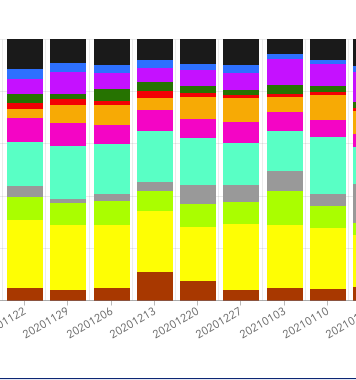
Proportional analysis of fatalities
Accounting for household and nursing home deaths by proportion in each state across the weeks of the pandemic.
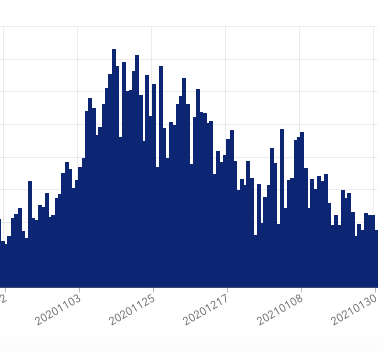
Day-to-day cases and fatalities
Two charts track the number of COVID-19 cases and fatalities on a daily basis across Midwestern states.