Geographic and Racial Disparities in School Pollution Burden

Latinx students in Chicago bear a disproportionate burden of area pollution
The spatial proximity burden distribution Heading link
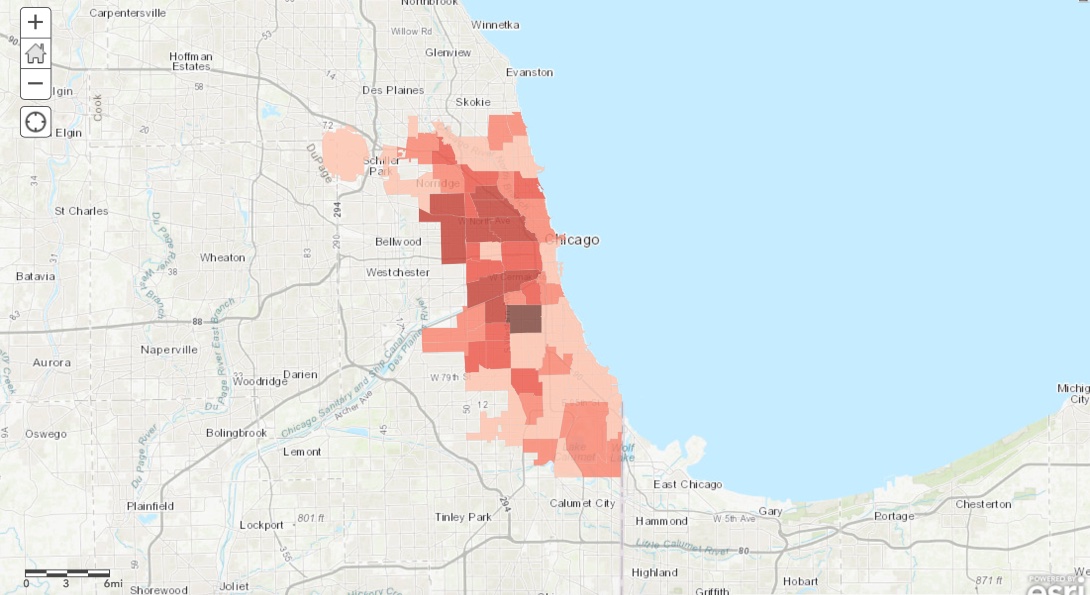
The map above shows the distribution of the Toxic Release Inventory (TRI) school proximity burden. As seen, the high burden areas are not randomly distributed within the City of Chicago, and some areas are allotted a significant burden (above two standard deviations from the mean). This finding underlines the need to further examine the socio-economic characteristics of the communities that bear the elevated proximity burden.
The racial dimension of disparities Heading link
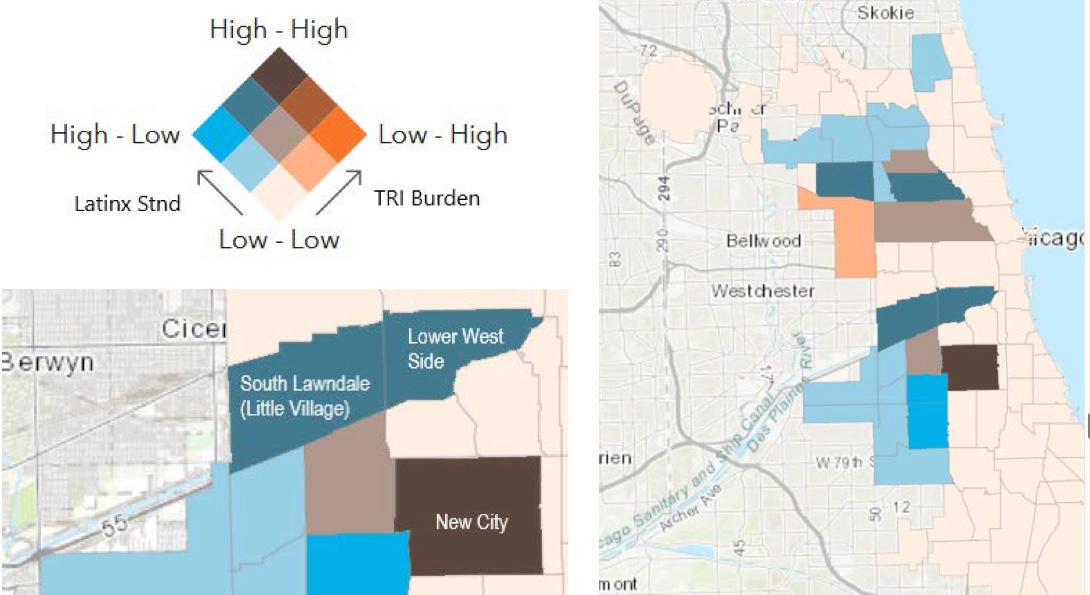
This dashboard provides the means to visualize the disparities and display the TRI school proximity burden scores in relation to the Latinx student population per community. This bivariate representation reveals the areas with an elevated burden and a high (or low) level of a Latinx student population.
The bivariate map, or more accurately choropleth map, enables users to visualize the spatial relationship between the burden and the Latinx student concentration for each community area. The tertiles of the two variables create the bivariate map, and we assigned the visually distinguishable 3-by-3 color scheme in the adjacent figure above. Thus, areas with an extreme discordance between the two variables are easily identified (the Low-Low and High-High light orange and dark brown edges of the color scheme). As seen from the bivariate representation above, the three community areas identified in the previous section (bearing the highest level of TRI school proximity burden) are as well communities with a predominant Latinx student population.
Benefit distribution Heading link
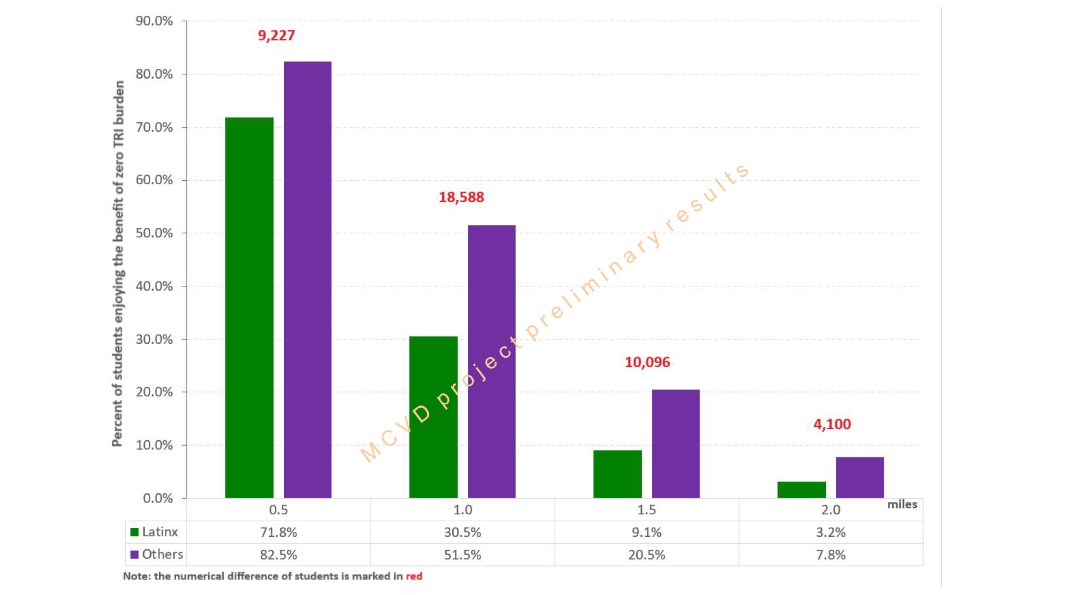
This study identified a number of schools with zero TRI reporting facilities at various radii. This status (i.e., zero TRI proximity) raises another question: are environmental benefits equally shared among the student population in Chicago? In this context, an environmental benefit is the lack of TRI reporting facilities at various radii. To answer this question we compare the percent of the Latinx student population that enjoys this benefit with the combined student population of all the other races (White, Black and Asian). Numerically, the two comparison groups are almost the same.
The above figure underlines that the environmental benefit of a zero TRI school proximity burden is not equally distributed in Chicago. For all the radii used, the Latinx school children are consistently at a disparity in comparison to the combine student population of Black, White and Asian students. This issue will be further explored in a forthcoming publication.