COVID-19 Data Analysis: Implications on Mortality Based on Race
Mortality in Chicagoland by race and residency status
| Black | Latinx | White | Other | Total | ||
|---|---|---|---|---|---|---|
| Household population | Count | 843 | 688 | 671 | 152 | 2,354 |
| Percentage share of household population | 35.8 | 29.2 | 28.5 | 6.5 | 100 | |
| Percentage share of racial/ethnic population | 55.5 | 78 | 37.7 | 49 | 52.4 | |
| Percentage of total population | 18.8 | 15.3 | 14.9 | 3.4 | 52.4 | |
| Long term care facility (LTCF) population | Count | 677 | 194 | 1,111 | 158 | 2,140 |
| Percentage share of LTCF population | 31.6 | 9.1 | 51.9 | 7.4 | 100 | |
| Percentage share of racial/ethnic population | 44.5 | 22 | 62.3 | 51 | 47.6 | |
| Percentage of total population | 15.1 | 4.3 | 24.7 | 3.5 | 47.6 | |
| Overall population | 1,520 | 882 | 1,782 | 310 | 4,494 | |
| Percentage of total population | 33.82 | 19.63 | 39.65 | 6.9 | 100 |
Age distribution of mortality
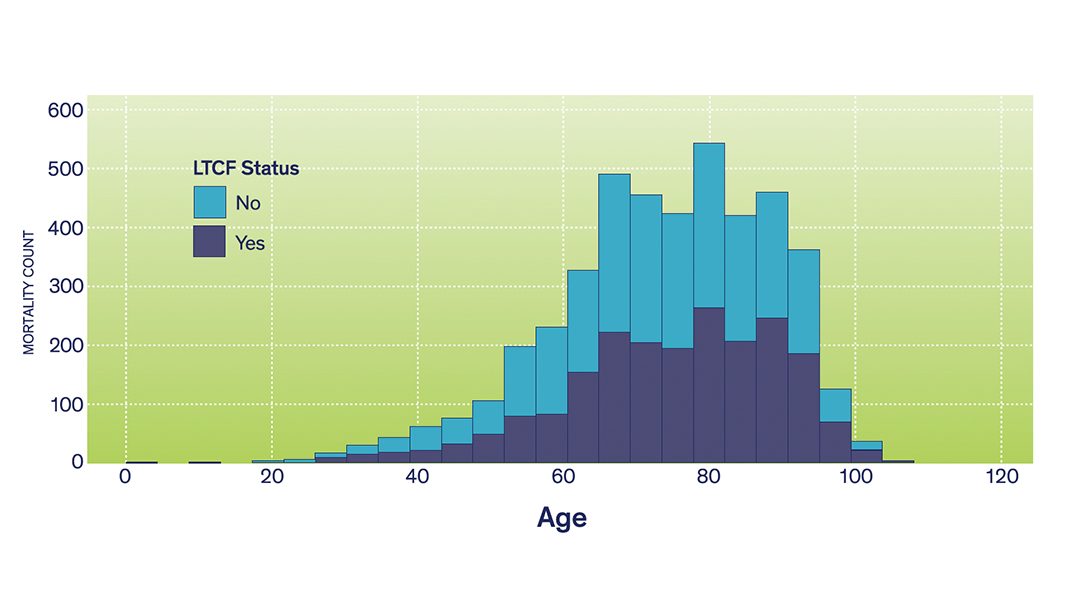
The age distribution of mortality by residency status is presented in the figure above. The overall pattern conforms to the mortality-age pattern established for the state of Illinois.14 In addition, this figure underlines the relative magnitude of the loss, especially for older adults above 80 residing in LTCF. Those less than 60 years of age within the LTCF distribution may be attributed to fatalities occurring in rehabilitation centers and specialized clinics, which are included in the LTCF sample.
Modified on August 24, 2020