Resource Response Brief: Illinois Healthcare Capacity in Preparing for the Peak of COVID-19 Cases by Mid-April
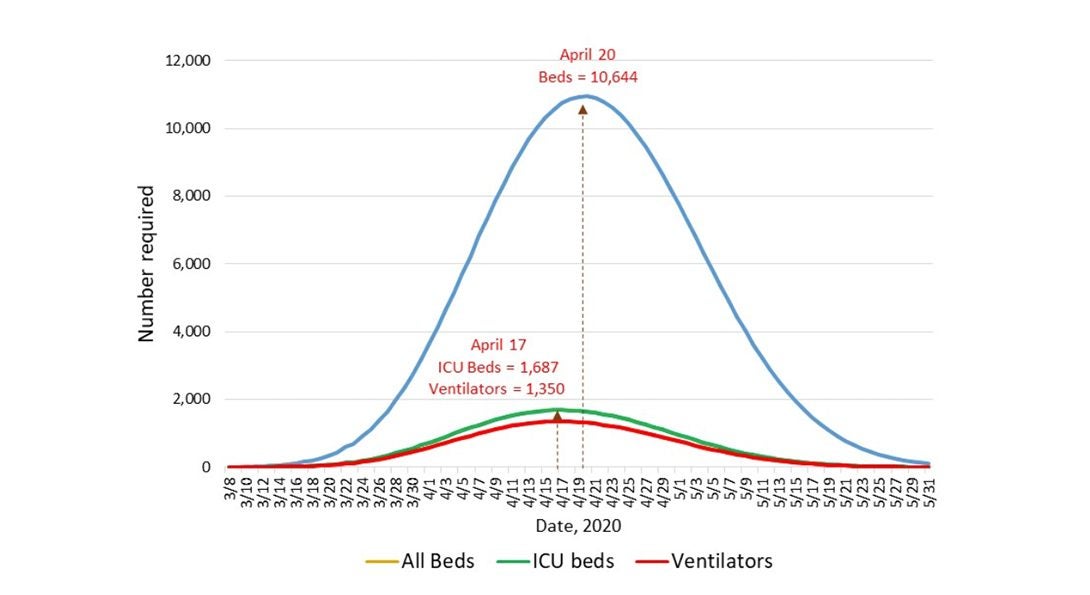
Illinois healthcare systems will need to coordinate statewide in order to the meet resource needs of the still escalating COVID-19 pandemic. The COVID-19 cases continue to rise throughout the State, with predictive models showing the peak is yet to come. The Institute for Health Metrics and Evaluation (IHME)’s latest update (April 2) estimates that the COVID-19 cases will peak in Illinois between April 17th and April 20th.
In preparing for the surge of cases and people requiring critical care, several models can be used to estimate number of hospital beds and ICU beds needed to adequately take care of Covid-19 cases. At the peak, Illinois is expected to need 10,994 beds (on April 20th) and 1,687 ICU beds and 1,350 ventilators (on April 17th). Similarly, the Global Health Institute suggests that Illinois potentially needs over 25,000 hospital beds and close to 5,000 ICU beds in the next 6 months.
Brief, continued Heading link
Our research shows that Illinois has a total of slightly more than 20,000 hospital beds and 3,500 ICU beds. In Chicago, there are 7,600 hospital beds and 1,500 ICU beds according to a recent Crain’s estimation. At baseline, Illinois’ total occupancy rate is at 55 percent. For Chicago hospitals, the bed occupancy rate is higher, at 62 percent. This means that 9,444 hospital beds and 1,591 ICU beds remain available for additional COVID patient care in Illinois, and 3,431 hospital beds and 700 ICU beds are available for COVID patient care in Chicago. To note, the number of beds that we use here is even lower than the number that the Harvard Global Health Institute uses to estimate shortage of healthcare capacity. See the table below.
As we have been tracking the pandemic through Illinois, the outbreak is not evenly distributed across the State. Instead, 75 percent of cases are within Cook County and 43 percent of the state’s cases are in Chicago.
The data suggests that a total of 4,705 hospital beds and 722 ICU beds are needed in Chicago. Compared with available number of beds in Chicago (3,431 hospital beds and 700 ICU beds), Chicago is expected to experience bed shortage at the peak of COVID-19 in mid-April.
While Illinois is expanding hospital bed capacity, including the additional 3,000 beds placed in McCormick Place Convention Center, state-wide centralized coordination and patient triage plans are equally important to consider. When considering the difficulty of obtaining ICU beds and ventilators, it becomes clear that maximizing existing Illinois’ healthcare utilization to better meet the localized needs will be an effective and important part of the response to the upcoming peak of COVID-19 cases and necessary healthcare. Perhaps a centralized dashboard that tracks hospital occupancy and triaging incoming patients accordingly will help greatly manage needs and capacity.
About the authors Heading link
Sage Kim, PhD, is an associate professor of health policy and administration at the University of Illinois at Chicago (UIC) School of Public Health.
Timothy Jostrand is a 2019 graduate from the MPH in Health Policy and Administration program at the UIC School of Public Health.
Alyshia Hamm is an MPH in Health Policy and Administration student at the UIC School of Public Health.
Hospital and ICU beds available in Illinois Heading link
Projection of Illinois hospital beds, ICU beds and ventilators needed during COVID-19 Heading link
| Date | All Beds | ICU Beds | Ventilators |
|---|---|---|---|
| March 8 | 2 | 1 | 0 |
| March 9 | 2 | 1 | 0 |
| March 10 | 15 | 4 | 3 |
| March 11 | 18 | 4 | 3 |
| March 12 | 38 | 9 | 7 |
| March 13 | 51 | 12 | 10 |
| March 14 | 64 | 15 | 12 |
| March 15 | 91 | 22 | 17 |
| March 16 | 115 | 27 | 21 |
| March 17 | 154 | 36 | 29 |
| March 18 | 187 | 42 | 33 |
| March 19 | 258 | 58 | 46 |
| March 20 | 343 | 75 | 60 |
| March 21 | 433 | 94 | 75 |
| March 22 | 603 | 132 | 106 |
| March 23 | 691 | 149 | 119 |
| March 24 | 906 | 196 | 156 |
| March 25 | 1,114 | 240 | 192 |
| Mach 26 | 1,371 | 296 | 237 |
| March 27 | 1,649 | 353 | 282 |
| March 28 | 1,972 | 416 | 333 |
| March 29 | 2,338 | 490 | 392 |
| March 30 | 2,718 | 556 | 445 |
| March 31 | 3,176 | 652 | 521 |
| April 1 | 3,623 | 728 | 582 |
| April 2 | 4,119 | 815 | 652 |
| April 3 | 4,627 | 903 | 722 |
| April 4 | 5,153 | 992 | 793 |
| April 5 | 5,708 | 1,080 | 864 |
| April 6 | 6,227 | 1,166 | 933 |
| April 7 | 6,818 | 1,249 | 999 |
| April 8 | 7,341 | 1,328 | 1,063 |
| April 9 | 7,869 | 1,402 | 1,122 |
| April 10 | 8,372 | 1,470 | 1,176 |
| April 11 | 8,843 | 1,528 | 1,223 |
| April 12 | 9,280 | 1,579 | 1,264 |
| April 13 | 9,672 | 1,620 | 1,297 |
| April 14 | 10,018 | 1,652 | 1,322 |
| April 15 | 10,314 | 4,674 | 1,340 |
| April 16 | 10,556 | 1,685 | 1,348 |
| April 17 | 10,744 | 1,687 | 1,350 |
| April 18 | 10,871 | 1,680 | 1,344 |
| April 19 | 10,939 | 1,664 | 1,331 |
| April 20 | 10,944 | 1,638 | 1,311 |
| April 21 | 10,890 | 1,604 | 1,283 |
| April 22 | 10,781 | 1,562 | 1,250 |
| April 23 | 10,612 | 1,513 | 1,210 |
| April 24 | 10,393 | 1,458 | 1,166 |
| April 25 | 10,127 | 1,397 | 1,118 |
| April 26 | 9,815 | 1,331 | 1,064 |
| April 27 | 9,462 | 1,260 | 1,008 |
| April 28 | 9,074 | 1,186 | 949 |
| April 29 | 8,658 | 1,111 | 889 |
| April 30 | 8,216 | 1,034 | 827 |
| May 1 | 7,755 | 957 | 765 |
| May 2 | 7,282 | 880 | 704 |
| May 3 | 6,800 | 804 | 643 |
| May 4 | 6,314 | 730 | 584 |
| May 5 | 5,833 | 659 | 528 |
| May 6 | 5,362 | 593 | 474 |
| May 7 | 4,898 | 529 | 423 |
| May 8 | 4,449 | 469 | 375 |
| May 9 | 4,019 | 413 | 330 |
| May 10 | 3,611 | 361 | 289 |
| May 11 | 3,228 | 315 | 252 |
| May 12 | 2,868 | 273 | 218 |
| May 13 | 2,535 | 235 | 188 |
| May 14 | 2,227 | 201 | 160 |
| May 15 | 1,946 | 170 | 136 |
| May 16 | 1,694 | 144 | 116 |
| May 17 | 1,463 | 122 | 98 |
| May 18 | 1,259 | 102 | 82 |
| May 19 | 1,078 | 85 | 68 |
| May 20 | 916 | 70 | 56 |
| May 21 | 774 | 57 | 46 |
| May 22 | 651 | 47 | 38 |
| May 23 | 545 | 38 | 31 |
| May 24 | 454 | 31 | 25 |
| May 25 | 376 | 25 | 20 |
| May 26 | 309 | 20 | 16 |
| May 27 | 253 | 16 | 13 |
| May 28 | 206 | 12 | 10 |
| May 29 | 167 | 10 | 8 |
| May 30 | 134 | 8 | 6 |
| May 31 | 107 | 6 | 5 |