Network Characteristics of Cook County Jail COVID Outbreak
About the report Heading link
This report was originally published by the Centers for Disease Control and Prevention as part of the Center’s Morbidity and Mortality Weekly Report.
CDC Morbidity & Mortality Weekly Report
Introduction Heading link

Correctional and detention facilities have been disproportionately affected by coronavirus disease 2019 (COVID-19) because of shared space and movement of staff members and detained persons within facilities1,2. During March 1–April 30, 2020, at Cook County Jail in Chicago, Illinois, more than 900 COVID-19 cases were diagnosed across all ten housing divisions, representing 13 unique buildings.† Movement within the jail was examined through network analyses and visualization, a field that examines elements within a network and the connections between them. This methodology has been used to supplement contact tracing investigations for tuberculosis and to understand how social networks contribute to transmission of sexually transmitted infections3–5. Movements and connections of 5,884 persons (3,843 [65 percent] detained persons and 2,041 [35 percent] staff members) at the jail during March 1–April 30 were analyzed. A total of 472 (12.3 percent) COVID-19 cases were identified among detained persons and 198 (9.7 percent) among staff members. Among 103,701 shared-shift connections among staff members, 1.4 percent occurred between persons with COVID-19, a percentage that is significantly higher than the expected 0.9 percent by random occurrence alone (p<0.001), suggesting that additional transmission occurred within this group. The observed connections among detained persons with COVID-19 were significantly lower than expected (1.0 percent versus 1.1 percent, p<0.001) when considering only the housing units in which initial transmission occurred, suggesting that the systematic isolation of persons with COVID-19 is effective at limiting transmission. A network-informed approach can identify likely points of high transmission, allowing for interventions to reduce transmission targeted at these groups or locations, such as by reducing convening of staff members, closing breakrooms, and cessation of contact sports.
All detained persons with data available for at least one bed assignment at Cook County Jail during March 1–April 30, 2020, were identified using records provided by Cook County Sheriff’s Office (CCSO), and Cermak Health Services. CCSO staff members who worked at least one shift at the jail during the same period were also included. A case of COVID-19 was defined as detection of SARS-CoV-2 by real-time reverse transcription–polymerase chain reaction (RT-PCR) in a specimen from a detained person, and, among staff members, as reported COVID-19–compatible symptoms or detection of SARS-CoV-2 in specimens by real-time RT-PCR. Detained persons who reported symptoms or who were a close contact of someone with a positive test result were tested; those who were not tested (2,763; 72 percent) or who received a negative test result (608; 16 percent) were grouped together for analyses and visualizations. Although staff members were not systematically tested, they were required to report symptoms of COVID-19 or receipt of positive test results immediately to CCSO; staff members reporting positive test results (confirmed case) or symptoms (probable case) were considered to have COVID-19. Staff member test results were confirmed through the Illinois National Notifiable Disease Surveillance System.
Description of networks Heading link

In the person-division networks, divisions represent housing buildings within the jail. Connections occur between persons (detained persons or staff members) and the divisions to which they are assigned, either for housing or a work shift. The number of connections between persons and divisions is calculated based on a value of one for each new bed assignment for detained persons or shifts within a given division for staff members.
To determine whether the number of connections to a given division was associated with a higher proportion of cases among staff members and detained persons, the linear correlation between the proportion of persons meeting the case definition during the study period and the number of connections was compared for each division, representing all persons linked to each division through at least one work shift (staff member) or cell or bed assignment (detained person). The strength of correlation was determined by calculating the correlation coefficients for each line of best fit, with statistical significance assessed at α = 0.05.
The person-person networks show persons present at the same location and time based either on shift or bed assignment. To determine whether connections between persons with COVID-19 in both groups were occurring more frequently than expected, the proportion of persons meeting the case definition was used to calculate ratios of observed-to-expected proportions of positive-positive, positive-negative (or not known to be positive), and negative-negative connections, and these ratios were compared using chi-squared tests of independence; significance was assessed at α = 0.05.
A joined network of detained persons and staff members was constructed but did not demonstrate clear patterns of clustering or spread. Detained person and staff member networks, displayed separately as unique patterns for each network, were more easily visualized. Data management and analyses were conducted using SAS (version 9.4; SAS Institute) and R (version 3.6.2; The R Foundation) statistical software; visualizations were performed using Gephi (version 0.9.2; The Gephi Consortium). This activity was reviewed by CDC and was conducted consistent with applicable federal law and CDC policy.§
The average daily census of detained person during March 1–April 30, 2020, was 4,884, with 3,834 (79 percent) included in the analysis based on availability of cell or bed assignment. Among the 1,080 detained persons tested during the same period, 472 (12.3 percent) received a positive SARS-CoV-2 test result. CCSO had 2,370 staff members assigned to Cook County Jail on March 1, 2020, most of whom worked on site. During the outbreak, 270 staff members were added, totaling 2,640. Among these, 2,041 (77 percent) were included in the analysis based on availability of shift and division assignments, 198 (9.7 percent) of whom had COVID-19; staff members with negative test results could not be identified through available data sources. During the outbreak, interventions were used to limit spread, including cessation of visitation (March 15), suspension of programmatic activities (March 23), conversion of cells to single occupancy, and universal masking for staff members (April 2) and detained persons (April 13).
Person-division networks Heading link
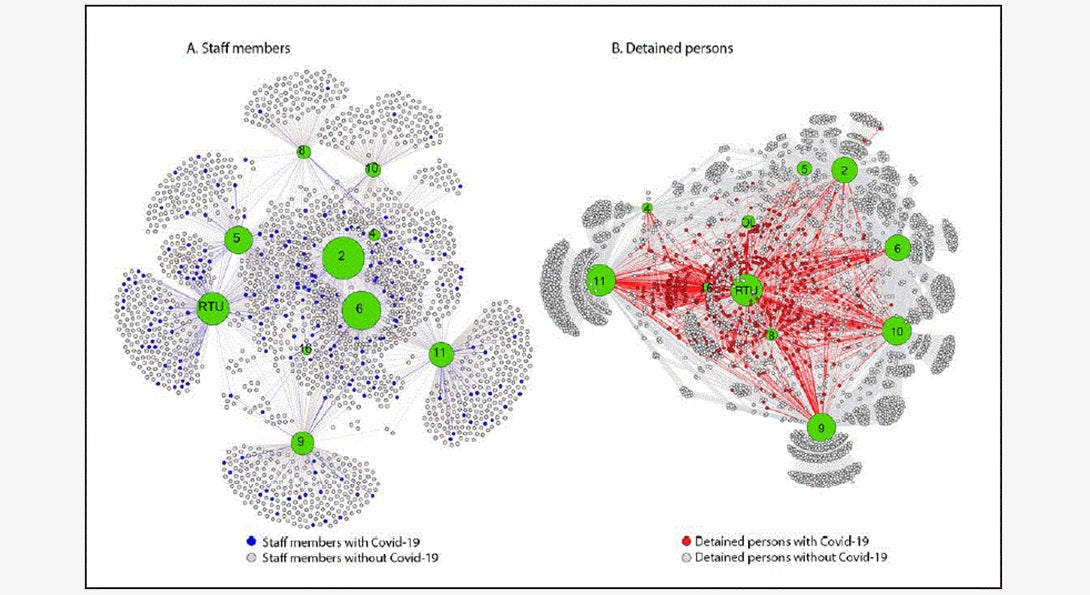
Visualization of networks among detained persons and staff members indicates that COVID-19 cases occurred in all jail divisions. The staff member network did not demonstrate a discernable pattern with distribution of persons with COVID-19 throughout divisions. Detained persons with COVID-19 appeared to cluster at division 8/residential treatment unit (RTU) and division 16, both of which were used for medical isolation, and offsite locations (e.g., hospitalizations).
Person-person networks Heading link
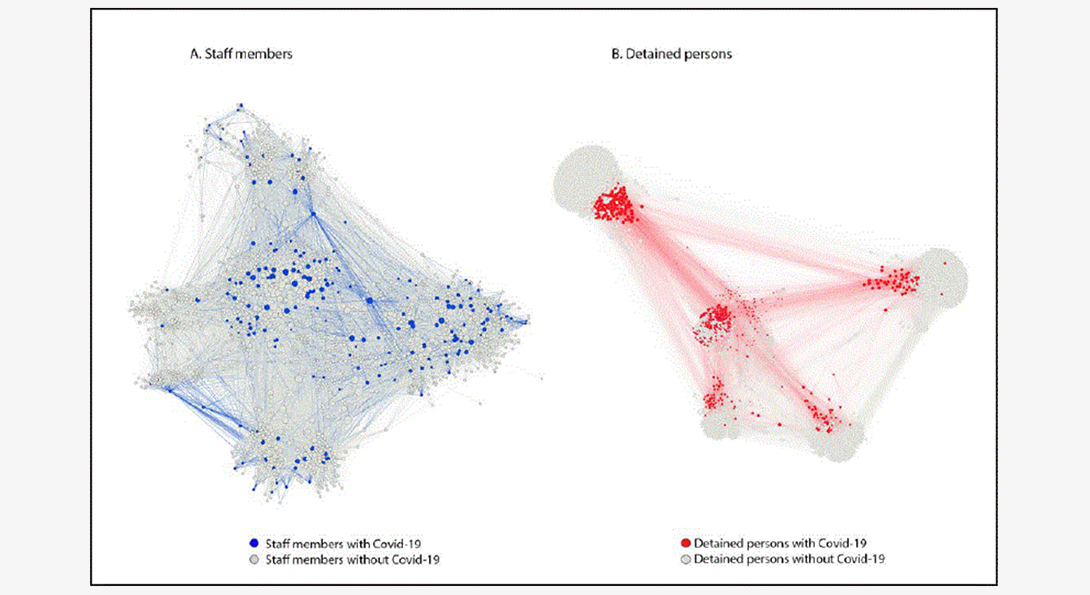
Overall, 103,701 shared shift connections occurred among staff members, 1.4 percent of which were between staff members with COVID-19; this exceeded the expected percentage (0.9 percent) (p<0.001). Among detained persons, 1,214,462 connections were identified, with 3.2 percent between two persons with COVID-19, which was also significantly higher than the expected 1.5 percent (p<0.001). The observed rate decreased to 1.0 percent when the divisions experiencing the highest clustering related to intentional movement as detained persons with COVID-19 were removed from the network (e.g., to RTU, division 16, or offsite locations). In March, as the number of persons with COVID-19 in the Cook County Jail was increasing, the mean number of interactions between staff members with COVID-19 (377) was significantly higher than that between staff members with negative test results (321) (p<0.001). This difference was not statistically significant in April, when the number of persons with COVID-19 in Cook County Jail was declining.
Correlation of positivity and number of connections by division Heading link
Overall, 3,278 connections across all divisions were observed between staff members and divisions, ranging from 80 connections in division 16, to 625 in division 2. The percentage of staff members with COVID-19 ranged from 2 percent in division 10 to 13 percent in RTU. A positive linear relationship was identified between the percentage of staff members with COVID-19 and the number of connections, by division (r = 0.86, p<0.05). Among detained persons, 6,056 unique connections were calculated (Figure 3). The number of unique connections ranged from 266 in division 4 to 1,037 in division 11, with percentage of detained persons with COVID-19 ranging from 6 percent in division 4 to 44 percent in RTU, and 98 percent in division 16.
Discussion Heading link
Network analyses and visualization of a large outbreak of COVID-19 at Cook County Jail demonstrate the complex transmission dynamics that can propagate disease spread, especially in a congregate setting. Connections among persons with COVID-19 occurred more often than expected in staff members and detained persons (p<0.001). The observed connections among detained persons with COVID-19 were significantly lower than expected when considering only the housing units in which initial transmission occurred, suggesting the systematic isolation of those with COVID-19 is effective at limiting subsequent transmission. These findings support the importance of rapid detection and isolation of persons with COVID-19 and limitation of movement between divisions as critical elements in reducing spread6,7.
The proportion of connections and number of unique connections by division among staff members with COVID-19 was higher than expected. The correlation between the percentage of staff members with COVID-19 and the number of unique connections by division also demonstrated a strong positive relationship (p<0.05). This likely reflects transmission among staff members; however, additional SARS-CoV-2 exposures not recorded in this analysis might also contribute, including staff members returning to their household and community after each work shift. The higher than expected percentage of staff members with COVID-19 reinforces the need for cohorting staff members (i.e., keeping groups together), maintaining consistency in shift assignment locations, and enforcing mask use for source control.
This is the first known report using network analyses and visualization techniques to describe a COVID-19 outbreak in a U.S. correctional or detention facility. Use of network analyses in China revealed disease occurring in clusters8. Another network study estimated and visualized pandemic risk by calculating worldwide connectedness using the newly confirmed COVID-19 case report counts9. These studies demonstrate the capability of a network approach to supplement traditional investigations and provide timely evidence to inform mitigation strategies and policy decisions.
The findings in this report are subject to at least four limitations. First, the networks described in this report were generated by time- and location-based connections among persons, which might not cover other types of disease transmission, such as fomite spread. Second, for this study, data for staff member work shift dates and locations were only available for CCSO staff members with assignments in housing divisions and not for those in functional roles (e.g., transportation or central kitchen), or other non-CCSO staff members on site (e.g., volunteers, and contractors). Persons not included in the staff member shift data might have interacted with persons in the staff member network. Third, staff members were not systematically tested; thus, this analysis possibly underrepresents the number of staff members with COVID-19 and their connections. In addition, although detained person and staff member networks are displayed separately to more easily visualize the patterns, interactions between these groups likely play an integral role in transmission in a detention facility. Finally, COVID-19 contacts and exposures occurring outside the jail or in the surrounding community, or from staff members with asymptomatic COVID-19, were not assessed in this analysis.
Network analyses and visualizations provide insight into disease spread, illustrating the effectiveness of certain control measures. This study demonstrates the consistent use of cohorting among detained persons and suggests effectiveness of employing this strategy. A network-informed approach can identify likely points of high transmission by demonstrating when transmission is higher than expected, allowing for interventions targeted at these groups or locations (e.g., reducing convening of staff members by closing breakrooms or cessation of contact sports).
About the authors Heading link
Peter Orris, MD, is the chief of occupational and environmental medicine at UI Health and a professor of environmental and occupational health sciences at the UIC School of Public Health.
Rebecca Levin, MPH in Health Policy and Administration ’02, is a senior advisor at the Cook County Sheriff’s Office.
Co-authors include: Uzay Kırbıyık, MD; Alison M. Binder, MS; Isaac Ghinai, MBBS; Chad Zawitz, MD; Usha Samala, MPH; Michelle Bryant Smith; Jane Gubser, PsyD; Bridgette Jones; Kate Varela, DVM; Josh Rafinski; Anne Fitzgerald; Alex Bahls; Sharon Welbel, MD; Connie Mennella, MD; Stephanie R. Black, MD; and Paige A. Armstrong, MD.
Acknowledgements Heading link
Thomas J. Dart, Cook County Sheriff, Illinois; Andrew Defuniak, Stamatia Richardson, Michael Miller, Brad Curry, Tarry Williams, Linda Follenweider, Jaqueline Tate, Kathryn Curran, Reena Doshi, Patrick Moonan, CDC; Public Health Informatics Fellowship Program, CDC COVID-19 Field Investigations and Epidemiology Special Studies Teams.
References Heading link
- Kinner SA, Young JT, Snow K, et al. Prisons and custodial settings are part of a comprehensive response to COVID-19. Lancet Public Health 2020;5:e188–9. CrossRefexternal icon PubMedexternal icon
- Wallace M, Hagan L, Curran KG, et al. COVID-19 in correctional and detention facilities—United States, February–April 2020. MMWR Morb Mortal Wkly Rep 2020;69:587–90. CrossRefexternal icon PubMedexternal icon
- Okano JT, Blower S. Preventing major outbreaks of COVID-19 in jails. Lancet 2020;395:1542–3. CrossRefexternal icon PubMedexternal icon
- Andre M, Ijaz K, Tillinghast JD, et al. Transmission network analysis to complement routine tuberculosis contact investigations. Am J Public Health 2007;97:470–7. CrossRefexternal icon PubMedexternal icon
- Campbell EM, Jia H, Shankar A, et al. Detailed transmission network analysis of a large opiate-driven outbreak of HIV infection in the United States. J Infect Dis 2017;216:1053–62. CrossRefexternal icon PubMedexternal icon
- Christakis NA, Fowler JH. The spread of obesity in a large social network over 32 years. N Engl J Med 2007;357:370–9. CrossRefexternal iconPubMedexternal icon
- CDC. Coronavirus disease 2019 (COVID-19): interim guidance on management of coronavirus disease 2019 (COVID-19) in correctional and detention facilities. Atlanta, GA: US Department of Health and Human Services, CDC; 2020. https://www.cdc.gov/coronavirus/2019-ncov/community/correction-detention/guidance-correctional-detention.html.
- Wang P, Lu JA, Jin Y, Zhu M, Wang L, Chen S. Statistical and network analysis of 1212 COVID-19 patients in Henan, China. Int J Infect Dis 2020;95:391–8. CrossRefexternal icon PubMedexternal icon
- So MKP, Tiwari A, Chu AMY, Tsang JTY, Chan JNL. Visualizing COVID-19 pandemic risk through network connectedness. Int J Infect Dis 2020;96:558–61. CrossRefexternal icon PubMedexternal icon