Illinois Revenue Losses Not as Severe as Expected

About the report Heading link
At the request of President Tim Killeen, IGPA has assembled more than four dozen interdisciplinary faculty experts from all three University of Illinois System universities to assess COVID-19’s effects on the state. Assessments focus on three impact groups: Economic and Fiscal Health, Community and Family Resilience, and the Health Care Workforce. Each group is collaborating on a series of modeling activities, data analyses, and syntheses of impact. This report is the fourth from the Economic and Fiscal Health Impact Group, which includes SPH’s Lisa Powell, PhD, professor of health policy and administration.
Executive Summary Heading link
The year 2020 proved to be one of the most volatile and destructive years in history. Not since the Spanish flu pandemic of 1918–1919 has the world seen the level of negative health, economic, and financial consequences witnessed last year. Although only one of many important consequences, state and local government finances suffered heavily under the weight of people self-isolating to avoid becoming ill, and from efforts to mitigate the spread of the virus imposed by state governments.
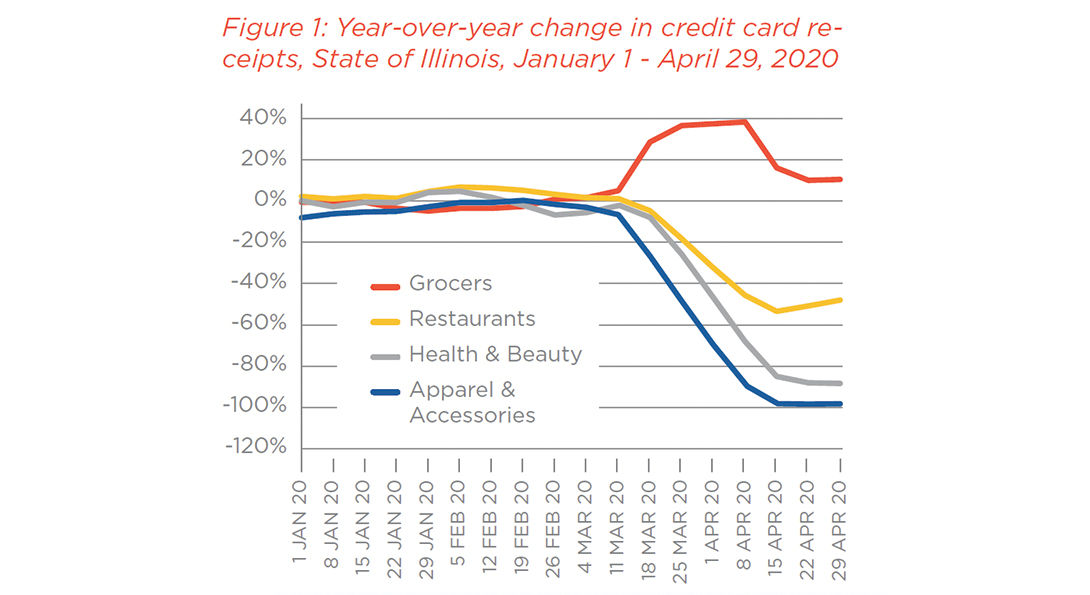
Illinois became one of the first states to enact a shelter-inplace order in late March.1 Even before that, high-frequency economic indicators suggested that people were starting to restrict activities to only those essential for sustaining life. Figure 1 shows the year-overyear changes for in-store credit card purchases at grocery stores, restaurants, and two categories of retail sales during the pre-pandemic and early pandemic period. A value of 0 percent indicates that retail sales in that category were the same as the year before. Therefore, the fall of between 50 percent and 60 percent in restaurant sales at the peak of the shutdown, the week of April 15, 2020, means that charges at restaurants fell to a level of only half of what they were in the same week in 2019. For reference, the average share of spending by households on food in 2019 was 13 percent of total household spending, with groceries accounting for just over half of that amount. Spending on apparel and services accounted for 3 percent of total spending, and personal care spending accounted for 1.2 percent.2
Starting in mid-March, sales at grocery stores rose dramatically as people stocked up for an extended period at home. Sales at restaurants and retail activities started to fall during this time. After the stay-at-home order was issued, sales at these locations plummeted. In April, as it became clear that the state would extend the stay-at-home order, concerns began to mount that the state and its local governments would see revenue fall dramatically as spending increased for social services and healthcare.
In early April, a report from the Economic and Fiscal Heatlh Impact Group releasing this report projected that revenue from the “Big Three” state revenue sources—individual and corporate income taxes and sales taxes—could fall as much as $4.8 billion in 2020 and by a similar amount in 2021.3 Many other sources projected similar revenue declines, including the Illinois General Assembly’s Commission on Government Forecasting and Accountability.4
Executive summary, continued. Heading link
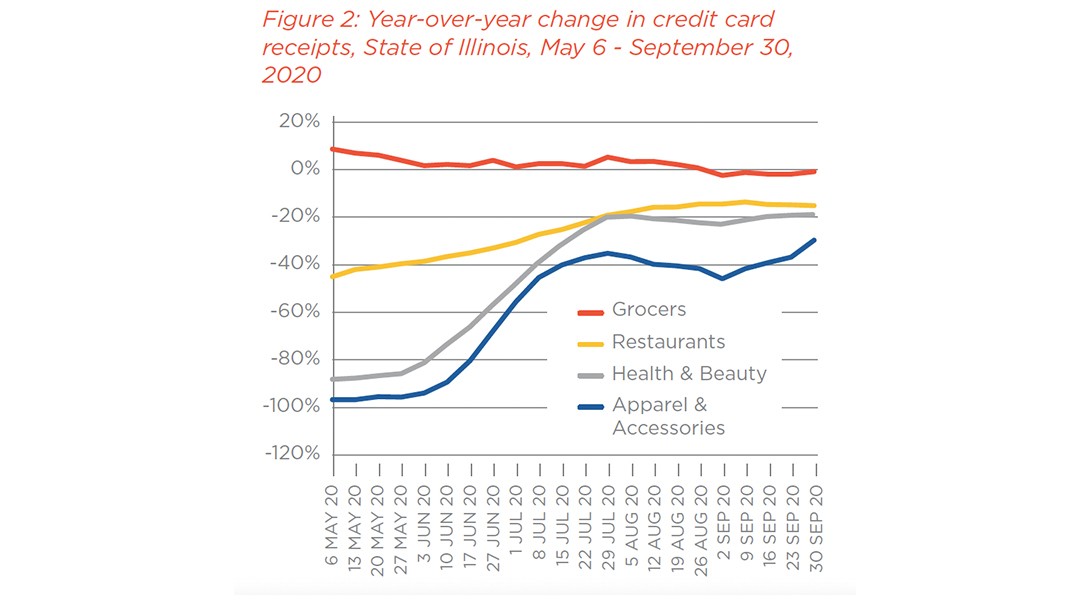
However, during May and June, an interesting thing started to happen. People began to adapt their behavior to their changing circumstances. Once retail establishments and restaurants began curbside pickup services, sales started to rise. The federal stimulus program pumped billions of dollars into the Illinois economy through stimulus checks and Paycheck Protection Program loans and credits, and acted as a catalyst for increased spending.5 Figure 2 shows the credit card spending for the period at the end of the first wave of COVID-19 until the fall of 2020. The recovery is clear in the spending data. For example, by the end of the second quarter, spending on apparel and accessories rose from a low of a nearly 100 percent annual fall in expenditures to between 25 percent and 30 percent below 2019 levels. And restaurants bounced back to only 15 percent to 20 percent below 2019’s spending rate.
Rebounding receipts caused us to wonder whether the revenue impacts of COVID-19 were as dire as predicted at the start of the pandemic. As described below, this report presents a statistical analysis of the impact of COVID-19 on state revenue sources.
We find that Illinois’ net revenue loss is much lower than what many projected at the beginning of the COVID-19 pandemic. The state did lose a sizable amount of revenue during the early months, but much of that loss was recovered.