COVID-19’s second wave: what lessons can be applied?

Examining data from Cook County, Illinois
Introduction Heading link
During the current public health crisis, many agencies and media outlets are reporting COVID-19 health outcome information based on the overall population of Cook County, Illinois. As we have demonstrated, overall COVID-19 case counts and mortality can be misleading. Moreover, they offer little guidance for delivering public health interventions to high risk populations, a critical need during this second and potentially more devastating wave of the pandemic.
Researchers with the UIC School of Public Health’s Public Health Geographic Information Systems program and Purdue University have been examining spatial and temporal patterns of COVID-19 mortality with a focus on the significant loss of life from COVID-19 among long-term care facility (LTCF) residents in contrast to mortality in the community among residents of private households. The goals of the study are:
- Improve the accuracy of commonly quoted COVID-19 mortality indicators
- Gain a better understanding of spatial and temporal distribution of COVID-19 deaths
- Examine the role of race, ethnicity, and socioeconomic status in COVID-19 mortality
- Identify population and organizational parameters that can inform strategies for public health interventions
Prioritizing the allocation of resources based on reliable information is a prerequisite of a successful mitigation strategy and immunization plan. Findings from our research have significant practical implications. The state and federal government face a series of policy decisions both due to the recent surge in positive cases and, when the time comes, the need to rationalize distribution of vaccines to high priority groups beyond healthcare workers and nursing home residents in critical areas. Our research team seeks to modify prevailing practices in order to derive reliable information that guides policy decisions. At this stage of the study, we have identified high-risk LTCFs and residential areas of Cook County from readily available, real-time mortality data.
Spatial distribution of COVID-19 mortality Heading link
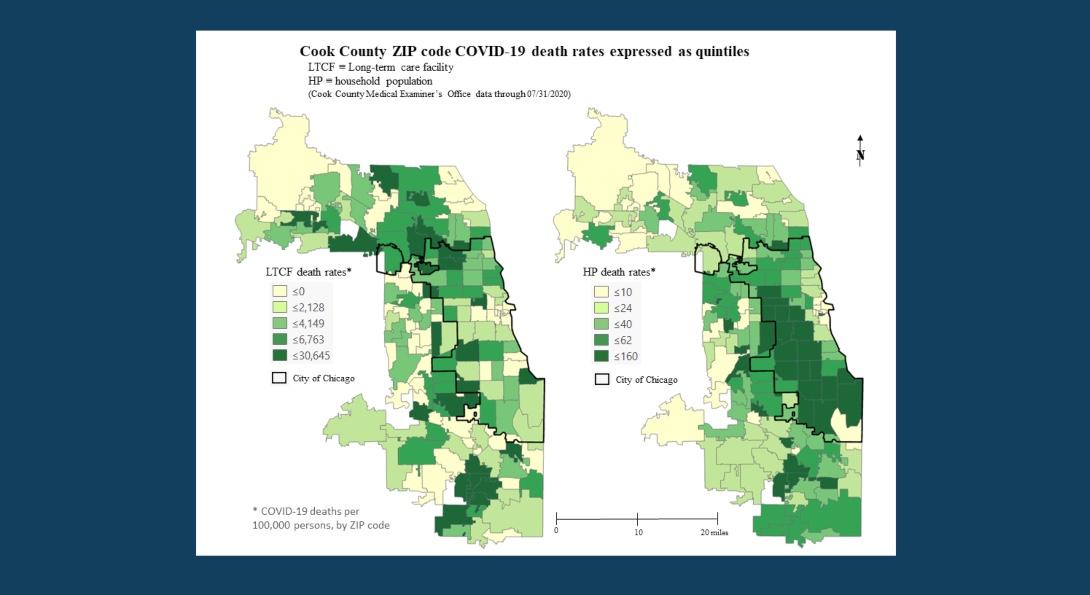
Our research has identified distinctly different spatial patterns in COVID-19 between LTCFs and community households. The chart above displays the percentage of COVID-19 deaths by zip code among LTCF residents compared to residents of households.
Characteristics of LTCFs and neighborhoods related to mortality rates Heading link
In preliminary analysis, we found three neighborhood (zip code) characteristics related to COVID-19 mortality among persons in the community: high percentage of minority group residents, high density of the population (per square mile operational definition) and low socio-economic status (SES) The mortality rates in neighborhoods with high concentrations of African-American and Hispanic populations had the highest adjusted COVID-19 death rates for these populations. These findings are in line with other studies finding an elevated risk of COVID-19 in minority populations.1,2
Higher density is a well-known predictor of disease exposure. The low SES workforce is concentrated in service jobs, including in healthcare, increasing the likelihood of COVID-19 exposure. Racial and ethnic disparities in health and healthcare likely increase risk of severe COVID-19 symptoms and mortality.
Rates of mortality in LTCFs were much more difficult to predict than household mortality. As implied the first chart, the rate of community mortality was unrelated to the rate among LTCFs in the same zip code. The percentage of non-white residents did not seem to be a predictor of LTCF mortality rates overall or for African American/Black or Hispanic residents. We should caution that our measure of race/ethnicity may be unreliable. We are continuing to explore other characteristics such as medical complexity of residents, rate of post-acute admissions and measures of overall care quality.
In our analysis of COVID-19 nursing facility data recorded by the Center for Medicare and Medicaid Services (CMS), we found a correlation between the number of COVID-19 cases among nursing facility staff and cases among residents.3 Also, we found patterns over time in incidence of COVID-19 cases among nursing facility staff that paralleled cases among residents. These findings raises the possibility, suggested by other researchers, that the community COVID-19 incidence is related to LTCF incidence and mortality at a more general level.4,5
Staff of LTCFs living in the wider community, outside the zip code of the LTCF and perhaps in high-risk neighborhoods, may be transmitting COVID-19 to LTCF residents.6 Simultaneously, LTCF facility staff may be contracting COVID-19 in the work setting and transmitting it back into the community. Another possible contributor to spread of COVID-19 in LTCFs is transfer of individuals between acute care hospitals and the LTCFs. According to CMS data, Cook County nursing facilities had more than 190 weekly COVID-19 admissions from the hospital in June, a drop in admissions to 50 per week from July – October, and then a sharp upward trend to 150 admissions per week in November.
Temporal patterns in mortality Heading link
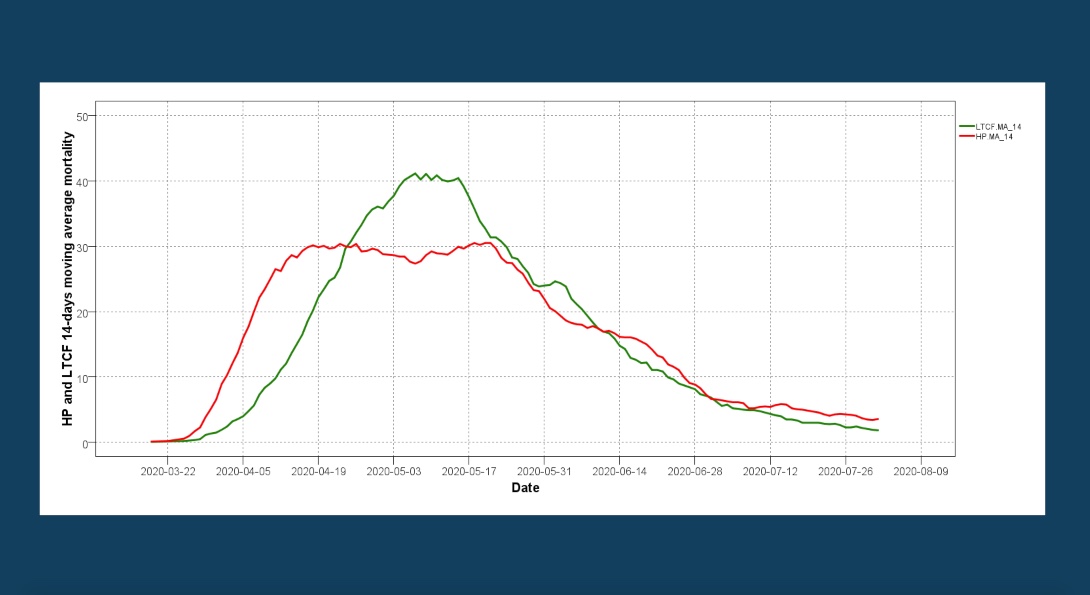
To demonstrate the benefits of the analytical framework developed by our team, we present results of an early risk detection with the use of moving averages. During the first wave in the spring 2020 (see the chart above), COVID-19 cases and mortality in LTCF have lagged behind the COVID-19 spreads and deaths in the community (household population). The time lag between the LTCF (green) and household population (red) losses probably represents the lag in transmission from community to LTCF. As seen in Figure 2, the LTCF-related losses peaked after surpassing the household population losses reaching an average death toll of 40 per day.
Temporal patterns in mortality, continued. Heading link
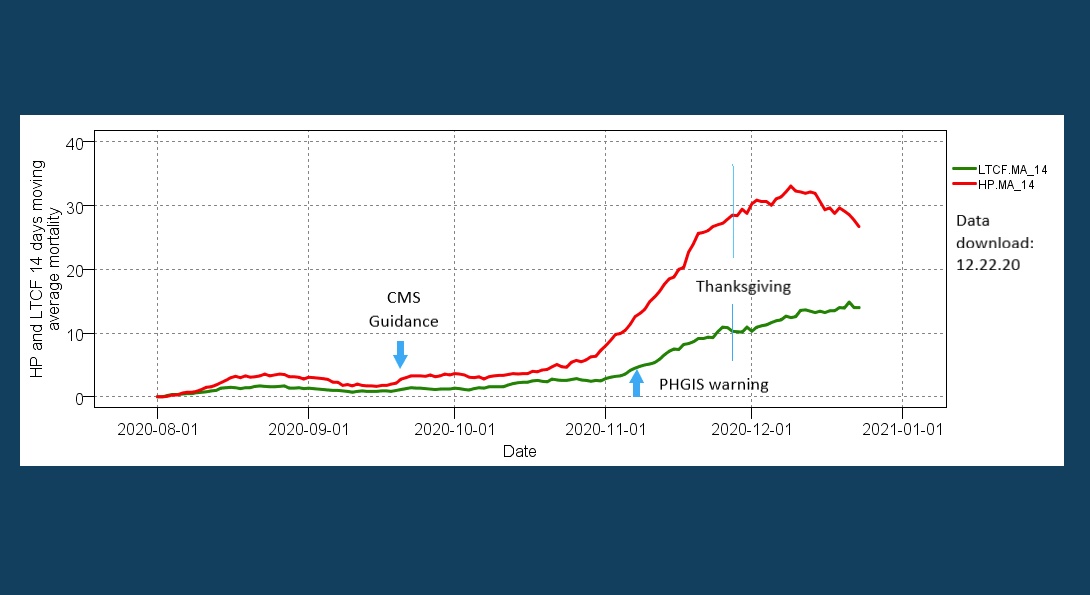
By taking into account the characteristics of the first wave, we performed an early assessment of the second wave pattern after the CMS guidance (initial pattern monitoring started in October; assessment and warning was made on November 8, 2020). The chart above displays the 14-day moving average of the household population and LTCF-related patterns of mortality. At the start, the almost parallel trajectories signify that the COVID-19 transmission pathway to the LTCF residents remained active during the low summer months. However, the latter part of the second wave graph raises serious concerns, since after mid-October it is likely that the LTCF related mortality is entering an acceleration phase similar (but less intensive) to the one seen during the first wave. In this context, “intensive” means the number of deaths per day over a given duration period – in this case, the lag-acceleration phase in days.
As of November 25, 52 percent of LTCF deaths in Cook County are located in 18 facilities and 10 ZIP codes. A month ago, the losses were two per day; currently losses are about ten per day. The risk that the overall death pattern will follow a similar but hopefully less intense trajectory is further substantiated with the 21-days moving average pattern of the LTCF losses (not shown). Without measures, this pattern raises serious concerns, since it is likely that within a week from now (December 5, 2020) the LTCF death toll will exceed the ten per day mark and continue its upward 14-days moving average trajectory.
Update (December 29, 2020): comparison of waves Heading link
We can compare household and LTCF mortality rates over time in the first and second waves using the Monod model.7 The 14-day moving average (14-MA) curves will provide useful information on mortality at different time points. The overall 14-MA pattern resembles a Monod model, or a microbial growth curve with its lag, acceleration, log, retardation, stationary and decay phases (see J. Monod publications and model). For the context of this project, we will simplify the terminology and use only the lag (null increase of deaths from previous date of reference), acceleration (positive increase of deaths), stationary (null increase of deaths from previous date of reference) and decay (negative increase of deaths).
To compare the two waves, we will use the cumulative deaths within the period defined by the start of the wave (lag and acceleration phase) and the start of the stationary phase (asymptote); denoted as days in the table below. The lag and acceleration rate defined as the ratio of cumulative deaths over the duration (days) is another useful metric.
Comparison of lag and acceleration phases for both waves Heading link
| First wave | Second wave (ongoing) | ||||
|---|---|---|---|---|---|
| Total deaths | Deaths during the lag-acceleration phase | Total deaths | Deaths during the lag-acceleration phase | ||
| Household population | Days | 126 | 32 | 87 | 74 |
| Cumulative losses | 2,380 | 670 | 1,598 | 1,124 | |
| Lag-acceleration rate (per day) | 20.9 | 15.2 | |||
| Long-term care facility population | Days | 126 | 49 | 87 | 87* |
| Cumulative losses | 2,215 | 995 | 691 | 691* | |
| Lag-acceleration rate (per day) | 20.3 | 7.9* |
Comparison of the first and second waves Heading link
The predictions of the lag-acceleration model and our early analysis of the second wave were unfortunately confirmed, and both groups (household population and LTCF) entered the acceleration phase for a prolonged period much longer than that of the first wave.
The first wave began on March 17,2020 and lasted 126 days. The household deaths began accelerating a few days into the wave and the acceleration continued for 32 days, at which time the curve reached an asymptote.During this period of acceleration for these first wave household deaths, 670 cumulative losses occurred resulting in a lag-acceleration rate of 20.9 (cumulative losses per period of days). The corresponding figures for LTCFs were 49 days to reach acceleration, 995 losses during the acceleration period, and a lag-acceleration rate of 20.3. Although the LTCF acceleration began later than the household population acceleration, the lag-acceleration rates for the two were essentially the same.
For the second wave, there is a transition lag phase which lasted more than a month, approximately from August to late September with only a stable two losses per day based on the 14-day moving average (essentially zero increase); for practical reasons, we will assume September 27, 2020 as a start of the lag-acceleration phase.
Each group enters the stationary phase at different dates; thus, the durations are different. The household population lag-acceleration period is 74 days, whereas the LTCF lag-acceleration period is 87 days. The second wave LTCF numbers are provisional since as of December 22, 2020, we do not know if the stationary phase for the second wave LTCF losses has started.
The maps and table signify that the second wave is different than the first. For household population mortality, the second wave lag-acceleration rate is only about 75 percent the rate as in the first wave (15.2 vs. 20.9). The lag-acceleration for LTCF deaths has been substantially lower: 7.9 in the second wave versus 20.3 in the first wave. However, if the decay phase of the second wave is prolonged or if the holidays period has a significant impact, then very likely within a few weeks the death toll of the second wave will exceed that of the first for the household population. Vaccination of high-risk areas might reverse this trend.
The LTCF death toll was minimized to some degree. The 14-moving average trajectory for LTCFs entered a prolonged acceleration phase rather than the rapid acceleration of the first wave. The implemented mitigation measures by nursing facilities after the first wave probably helped to prevent the tragic losses seen during the first wave. As we noted, the lag-acceleration rate is significantly less in the second wave (7.9 as opposed to 20.9) and the 14-moving average level of losses is close to 15 as opposed to 40; however, after 87 days of deaths we do not yet know if the LTCF losses have entered the stationary/decay phase, or if they might accelerate. The implemented vaccination program for LTCF residents, which started on December 28, 2020, will hopefully reverse this trend.
In forthcoming analyses, the differences between the two waves will be further substantiated and the role of certain social determinants will be visualized.
Strategies to address a second wave of COVID-19 Heading link
From a policy point of view, the above findings raise a number of issues that demand immediate public health action. Such action is imperative in order to avoid seeing losses climb to a five-day moving average of 40 fatalities per day seen in the first wave. The first wave put enormous strain on LTCFs under circumstances of staff shortages and limited access to PPE.8
The LTCFs are probably in a better position now to contend with COVID-19 compared to March when the initial COVID-19 surge began. According to reports for the week ending November 15 (CMS data), all Cook County nursing facilities had access to COVID-19 testing for residents and staff. Yet, only 26 percent of facilities had testing at the point of care and only 3 percent of facilities could obtain same-day results. Approximately 75 percent of nursing facilities completed surveillance COVID-19 testing of asymptomatic staff or residents; the other one-fourth only tested when a person exhibited symptoms or had been in contact with a person having COVID-19. More than 95 percent of facilities reported having a seven-day supply of masks, eye protectors and gowns. In addition, 91 percent of facilities reported no nursing staff shortages the week of November 15. However, it remains to be seen if staff shortages might arise in subsequent weeks with a new surge of COVID-19 cases.
Our findings lead to a two-pronged approach aimed at breaking the cycle of transmission from community to LTCFs. Public health officials should re-double efforts to prevent a community surge through:
- Clearly articulated policies for social distancing, face covering and restricted access to high-risk setting for spread of COVID-19
- Targeted testing in hot-spot or likely to be hot-spot neighborhoods that are densely populated, low income and have concentrations of minority groups
- Targeted interventions for vulnerable at-risk populations (with co-morbid conditions, advanced age and residing in at-risk neighborhoods).
When COVID-19 vaccines become available, they should be targeted to areas of the city at highest risk. These interventions should combine resources of health departments, Area Agency on Aging and health systems to reach out to at risk individuals.
With regard to LTCFs, health system and public health agencies should devote resources to up-stream prevention of COVID-19 spread and mortality among LTCF residents before they are hospitalized and strain ICU capacity. The CDC,9 Illinois Department of Public Health10 and other sources11 have urged these actions:
- Contact tracing of LTCF staff and residents
- Rapid testing of LTCF residents and staff
- Emergency nursing and medical support for burned out and depleted LTCF staff
- Transitional support between nursing facilities, hospitals, and community
- Vaccinate, as a priority, LTCF residents and all staff when COVID-19 vaccines become available
- The issue of priority vaccinations for high risk communities should also be addressed
LTCFs should receive financial and other resources to step up their mitigation efforts, including carefully controlled visitation, isolation, PPE and other infection control practices.
Targeting areas of the city Heading link
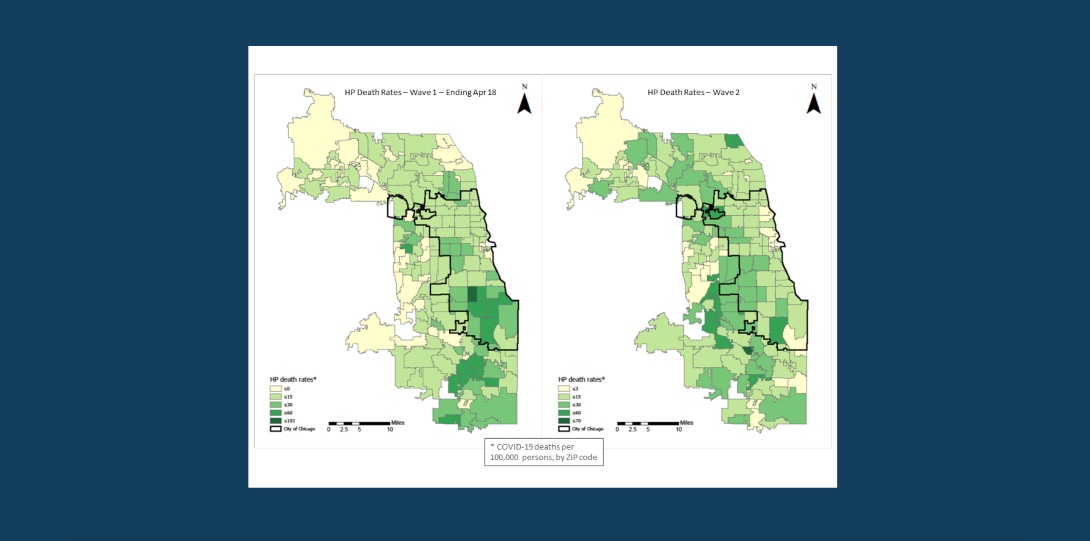
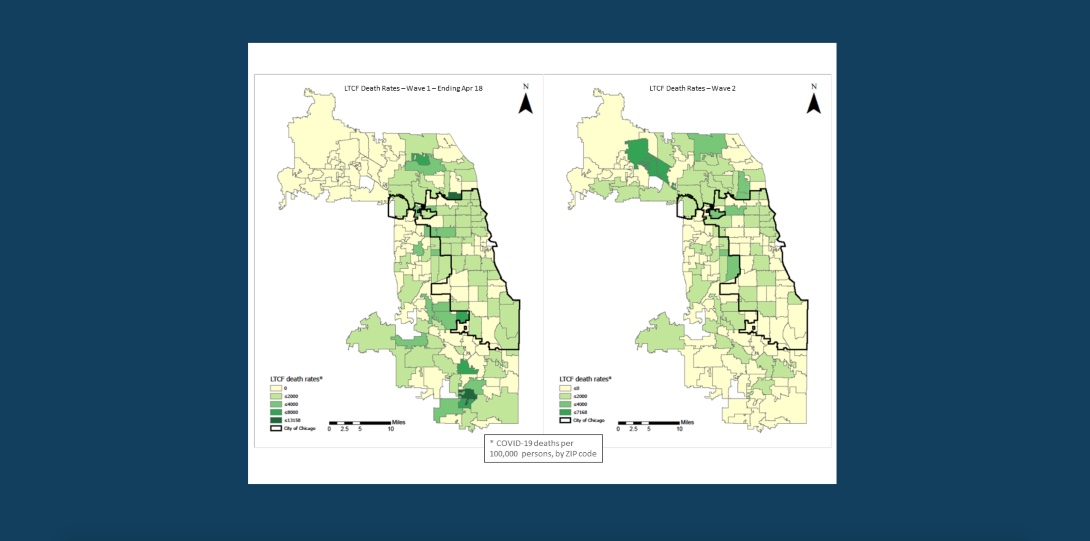
The analytical framework developed by our team provides a better visualization of the areas hard hit during the second wave. This visualization can assist policymakers in addressing the high risk areas which are different than those during the comparable first wave phase. This is seen in the two maps int he slideshow below, where a comparable first data period is used. For the household population, the majority of high death rate areas are concentrated in the periphery of Chicago, whereas the comparable first wave areas where concentrated in the south and south east section. The LTCF distribution is different, and the majority high death rate areas are concentrated in the northwest part of Cook County, whereas the comparable first wave areas where concentrated in the southwest.
First and second wave maps for Cook County, Illinois Heading link
Conclusions Heading link
Prevailing practices which rely on overall population numbers are unreliable and can be misleading. We have shown how information on spatial and temporal patterns in COVID-19 mortality can guide policies to address high priority areas in Cook County. By focusing on high-risk LTCFs and residential areas, protective measures can be implemented to minimize COVID-19 spread and subsequent mortality. When COVID-19 vaccines become available, they should be distributed to the same high-risk populations.
About the authors Heading link
- Greg Arling, PhD, is a professor of nursing at Purdue University.
- Matthew Blaser is a geographic information systems research associate at the U.S. Environmental Protection Agency (EPA).
- Michael D. Cailas, PhD, is an associate professor of environmental and occupational health sciences at the UIC School of Public Health. He directs SPH’s Public Health Geographic Information Systems online certificate program, and his research focuses on water quality monitoring network design, environmental data analysis, risk assessment and cost benefit analysis
- John Canar, PhD in Environmental and Occupational Health Sciences ’97, is an environmental scientist at the U.S. EPA’s Superfund Division and an adjunct assistant professor of health policy and administration at the UIC School of Public Health.
- Brian Cooper is a program manager with the U.S. EPA’s Field Environmental Decision Support team within the Superfund Division and an affiliate faculty member with SPH’s division of health policy and administration.
- Peter J. Geraci is an affiliate faculty member with SPH’s division of health policy and administration.
- Kristin Osiecki, PhD in Environmental and Occupational Health Sciences ’13, MS in Environmental and Occupational Health Sciences ’11, is an assistant professor at the University of Minnesota Rochester and an adjunct instructor of health policy and administration at the UIC School of Public Health.
- Apostolis Sambanis, PhD in Environmental and Occupational Health Sciences ’16, MS in Environmental and Occupational Health Sciences ’12, is the director of curriculum with SPH’s Emergency Management and Resilience Planning certificate program.
References Heading link
- Selden TM, Berdahl TA. COVID-19 And Racial/Ethnic Disparities In Health Risk, Employment, And Household Composition: Study examines potential explanations for racial-ethnic disparities in COVID-19 hospitalizations and mortality. Health Affairs. 2020;39(9):1624-1632.
- Figueroa JF, Wadhera RK, Lee D, Yeh RW, Sommers BD. Community-Level Factors Associated With Racial And Ethnic Disparities In COVID-19 Rates In Massachusetts: Study examines community-level factors associated with racial and ethnic disparities in COVID-19 rates in Massachusetts. Health affairs. 2020:10.1377/hlthaff. 2020.01040.
- Centers for Medicare and Medicaid Services. COVID-19 Nursing Home Data. Published 2020. Accessed July 12 2020.
- Sugg MM, Spaulding TJ, Lane SJ, et al. Mapping community-level determinants of COVID-19 transmission in nursing homes: A multi-scale approach. Science of the Total Environment. 2020;752:141946.
- Nguyen LH, Drew DA, Graham MS, et al. Risk of COVID-19 among front-line health-care workers and the general community: a prospective cohort study. The Lancet Public Health. 2020;5(9):e475-e483.
- Chen MK, Chevalier JA, Long EF. Nursing home staff networks and COVID-19. National Bureau of Economic Research;2020. 0898-2937.
- Monod J. The Growth of Bacterial Cultures. Annual Review of Microbiology. 1949 3:1, 371-394
- McGarry BE, Grabowski DC, Barnett ML. Severe staffing and personal protective equipment shortages faced by nursing homes during the COVID-19 pandemic: Study examines staffing and personal protective equipment shortages faced by nursing homes during the COVID-19 pandemic. Health Affairs. 2020;39(10):1812-1821.
- Centers for Disease Control and Prevention. COVID-19 Nursing Homes and Long-Term Care Facilities. Published 2020. Accessed November 22 2020.
- Illinois Department of Public Health. Long-Term Care Facilties Guidance. Published 2020. Accessed November 22 2020.
- McGilton KS, Escrig-Pinol A, Gordon A, et al. Uncovering the devaluation of nursing home staff during COVID-19: are we fuelling the next health care crisis? Journal of the American Medical Directors Association. 2020;21(7):962-965.